NOPA Benchmarking Reports Archive
Data is one of the keys to moving your business to the next level and NOPA assists you in finding the research you need. How do you match up to your competition? What benefits do other dealers provide? What trends are facing the industry? Those are just a few examples of questions that may be included in member surveys and benchmarking reports.
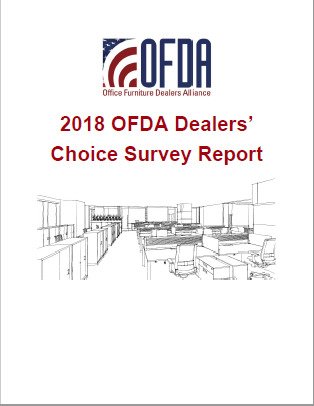
2018 OFDA Dealers' Choice Survey Report

NOPA's sister organization, Office Products Dealers Alliance (OFDA) conducts the Dealers’ Choice Survey. It is a carefully structured, anonymous dealer poll that measures six functional areas of manufacturer performance that are of greatest importance to a diverse cross-section of dealers throughout North America.
This survey is aimed at providing product-category-level feedback from dealers of all sizes on the full range of support they receive from their primary non-aligned suppliers. Dealers were asked to rate these top-volume non-aligned suppliers in each of six product categories recognized by the Business and Institutional Furniture Manufacturers Association (BIFMA):
- Casegoods
- Filing
- Seating
- Storage
- Tables
- Workstations/Systems
View a copy of the 2018 OFDA Dealers' Choice Survey Report.
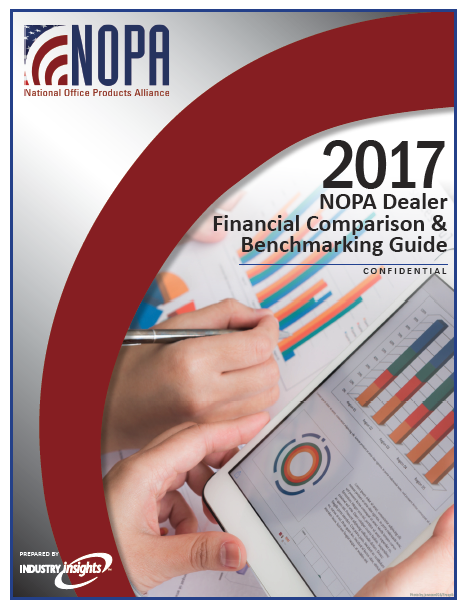
2017 NOPA Dealer Financial Comparison & Benchmarking Marking Guide
 This guide presents a detailed analysis of key operating data from the office products dealers industry. The information contained in this report is designed to provide easy to understand guidelines for identifying business strengths, weaknesses, and performance improvement opportunities. This guide presents a detailed analysis of key operating data from the office products dealers industry. The information contained in this report is designed to provide easy to understand guidelines for identifying business strengths, weaknesses, and performance improvement opportunities.
This report includes comparative financial ratios and statistics by:
- All participants overall
- Dealer revenue volume size
- Size of market area
- Other important criteria.
In addition, this report includes data for a special grouping of high profit vs. low profit dealers. If you particpated in this survey, you also have access to a confidential company performance report, which includes the company's own ratios and data computed in a manner consistent with those appearing in the industry report and displayed along the appropriate industry comparative.
View a copy of the 2017 NOPA Dealer Financial Comparison & Benchmarking Guide.
2016 NOPA Compensation & Benefits Report

This report is designed to easily compare compensation levels and benefit policies with their peers. Easily compare over 50 common job titles in the industry. These job titles including positions in the following categories:
- Administrative / IT
- Customer Service
- Design
- Installation / Service
- Sales and Marketing
- Warehouse and Distribution
In addition to compensation information, responding companies provide data on health care costs/trends; retirement benefits; vacations/PTO and holidays; sick and other leave; compensation practices and strategies; as well as turnover and overtime pay.
View a copy of the 2016 NOPA Compensation & Benefits Report.
|


 This guide presents a detailed analysis of key operating data from the office products dealers industry. The information contained in this report is designed to provide easy to understand guidelines for identifying business strengths, weaknesses, and performance improvement opportunities.